Insight
Smart charging keeps home charging below the CREG rate, even when prices rise
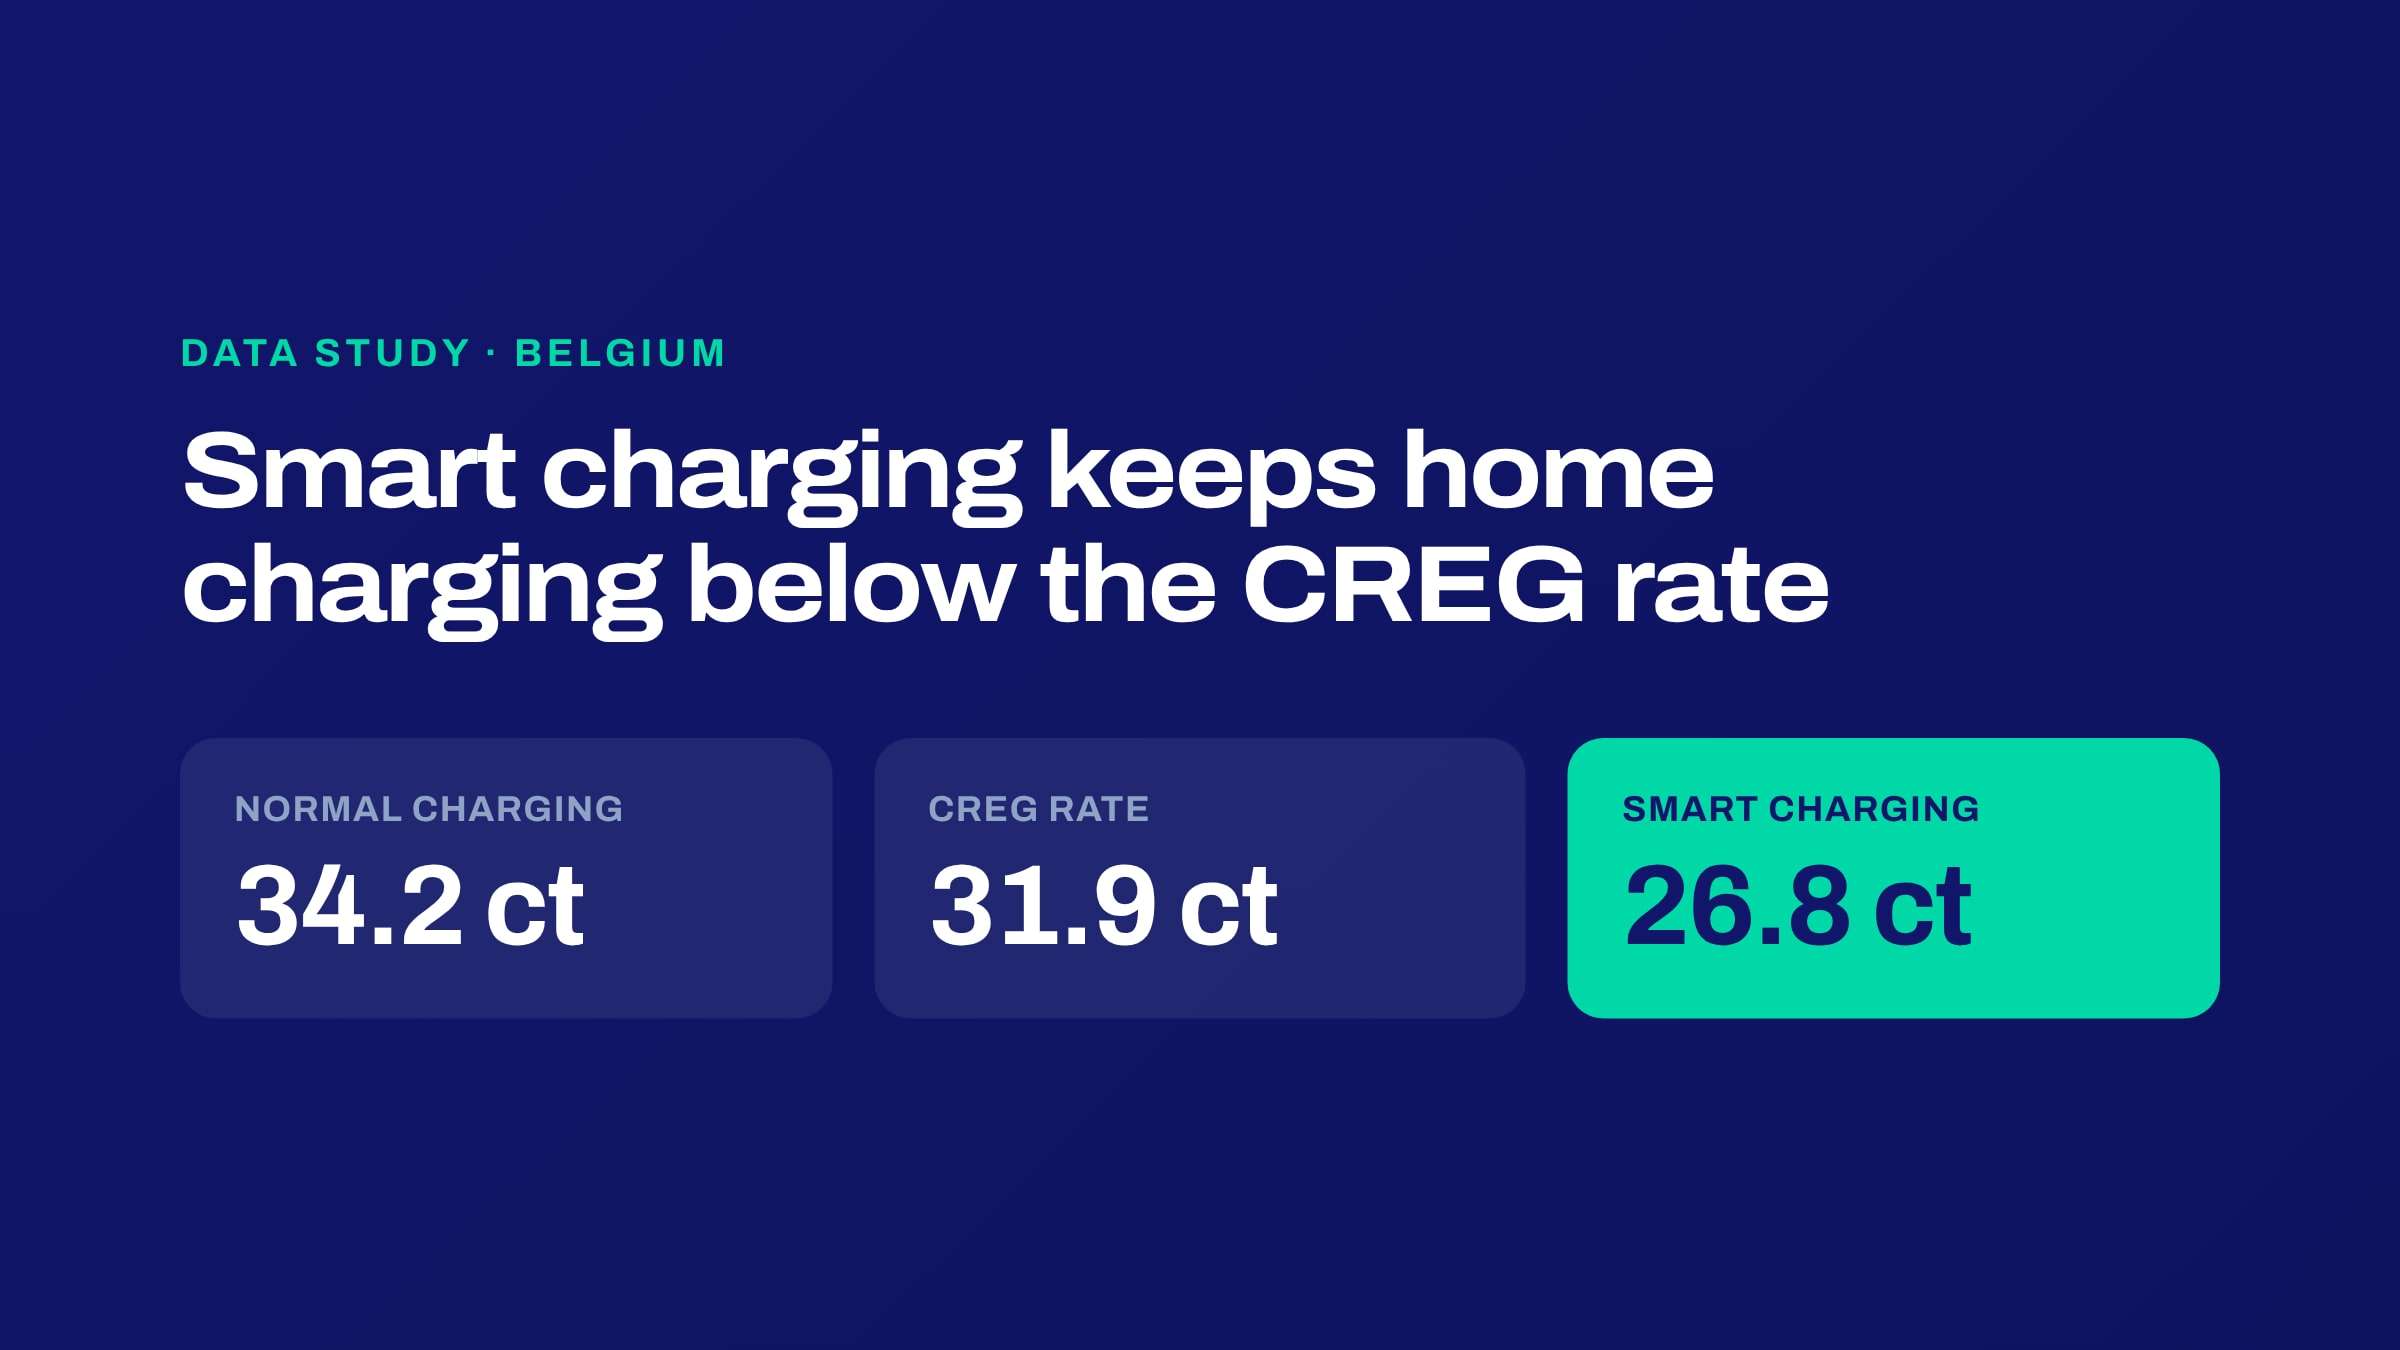
We analysed a year of meter and charger data from nearly 1,000 Belgian homes. Normal charging costs 34.2 ct per kWh, above the CREG rate. Smart charging costs 26.8 ct, 5.2 ct below it, even when prices rise.
Published · 6 min read
Employees with an electric company car lose money when they charge at home: that is what recent press coverage says. We checked it against a full year of meter and charger data from nearly 1,000 Belgian homes. The answer depends on one thing: whether the car charges smart.
Over the year, per kWh charged at home
Even in October 2026, the most expensive month, smart charging stayed below the CREG rate: 30.9 ct against 32.5 ct, while normal charging cost 37.7 ct.
Why we did this study
In Belgium, most employers reimburse home charging of a company car at the rate the CREG publishes every quarter. It is simple and fiscally safe, but it is one fixed number per region. What a driver really pays depends on when the car charges, how much the charging raises the household’s monthly peak under the capacity tariff (in Flanders), and how much solar energy it can use.
When charging at home costs more than the reimbursement, drivers pay part of it themselves. A driver who loses money at home has every reason to charge elsewhere: at the office, or at a public charger, which is far more expensive for the fleet. The cheapest kWh a fleet can buy is a kWh charged at home, so home charging has to stay attractive for the driver.
Scopt steers home chargers for charge point operators, using a P1 dongle on the digital meter. That gives us the actual energy flows of every home, every quarter of an hour, next to the energy the car charged. So we could measure what a charged kWh really costs, with and without smart charging.
How we compared normal and smart charging
We took every charging session of the year and calculated its cost twice.
- Smart charging: how the cars actually charged with Scopt, with peak shaving, solar charging or Autopilot.
- Normal charging: the same sessions without any steering. The car starts charging at 6 kW the moment it is plugged in, until it has the same energy. That is about the household peak the CREG rate itself assumes. Normal charging also uses solar energy, whenever the sun happens to shine while the car charges.
Both are priced the way they show up on the driver’s energy bill: grid energy at the price of the driver’s contract type (fixed, variable or dynamic) with network costs, levies and VAT; in Flanders, the extra capacity tariff caused by charging; and solar energy at the injection income the driver gives up. We compare the result with the CREG rate of the driver’s region and quarter.
Normal charging costs more than the CREG rate. Smart charging costs a lot less.
Over the year, normal charging cost 34.2 ct per kWh, 2.2 ct above the average CREG rate of 31.9 ct. Smart charging cost 26.8 ct: 22% less, and 5.2 ct below the CREG rate.
For a driver who charges about 2,700 kWh a year at home, that is the difference between paying around €60 a year out of pocket and keeping around €140: a swing of about €200 per driver per year.
| Contract type | Normal charging | Smart charging | Saving |
|---|---|---|---|
| Fixed | 36.0 ct | 28.6 ct | −7.4 ct (−21%) |
| Variable | 33.5 ct | 25.9 ct | −7.6 ct (−23%) |
| Dynamic | 32.0 ct | 25.6 ct | −6.4 ct (−20%) |
| All drivers | 34.2 ct | 26.8 ct | −7.4 ct (−22%) |
The CREG rate averaged 31.9 ct for every contract type. With smart charging, 84% of drivers charged below it, against 37% with normal charging.
Even in the expensive months, smart charging stays below the CREG rate
Energy prices rose sharply in the autumn of 2026, and the CREG rate only follows with a delay of about five months. Normal charging climbed to 37.7 ct per kWh in October, 5.2 ct above the CREG rate. Smart charging stayed below the CREG rate in every month of the year, October included.
Where the saving comes from
- −6.0 ctPeak shaving under the capacity tariff (Flanders only). Charging at full power the moment the car is plugged in adds on average 4.6 kW to the household's monthly peak. Smart charging keeps that to 1.6 kW, by charging around the household's own consumption instead of on top of it. The capacity tariff only exists in Flanders, so this saving applies to Flemish drivers.
- −1.4 ctSolar and timing. Smart charging takes 17% of the car's energy from the home's own solar panels, against 12% for normal charging. On a dynamic contract it also charges in the cheapest quarter-hours. In Brussels and Wallonia, where there is no capacity tariff, these are the levers that bring the cost down: solar charging and, on a dynamic contract, charging in the cheapest quarter-hours.
In Flanders, the capacity tariff is the biggest lever. A car that charges at full power on top of the evening cooking and heating sets the monthly peak, and the driver pays for that peak all year.
No solar panels? Smart charging still makes the difference.
Drivers without solar panels pay the most for normal charging: 37.6 ct per kWh, 5.6 ct above the CREG rate. With smart charging that drops to 31.9 ct, back under the CREG rate of 32.0 ct. That is 5.6 ct per kWh, around €165 a year, and in Flanders peak shaving does almost all of it.
What this means for fleet managers
The debate is often framed as a question about the reimbursement rate. Our data shows that the bigger lever is how the car charges at home.
- Make smart charging standard in every home charging package. It turns a kWh that costs more than the CREG rate into one that costs well below it.
- Give drivers comfort and insight. A driver who sees that charging at home costs less than the reimbursement has no reason to look elsewhere, and smart charging runs by itself, without the driver thinking about it every evening.
- Keep the kWh at home. Every session that moves from a public charger to the driver’s home is a direct saving for the fleet. Smart charging keeps home charging attractive, also when energy prices rise.
Charge smart at home, and more employees will charge at home with comfort. That is what brings the cost of an electric fleet down.
Smart charging for your drivers
Scopt is the white-label smart charging layer behind the home charging offer of charge point operators. It works on any OCPP charger, with a P1 dongle the driver installs in minutes. Want to see how it works for your fleet or your customers?
How it worksData and sources
- Charging and energy data: Scopt platform, P1 meter data and charger data per quarter-hour, nearly 1,000 Belgian homes, November 2025 to October 2026. Results are aggregated; no individual data is published.
- CREG home-charging rate per quarter and region: FOD Financiën circulars 2024/C/77 and addenda (2025/C/60, 2025/C/72, 2026/C/44, 2026/C/68, 2026/C/86).
- Energy prices per contract type: VREG V-test open data (median offer per month), CREG monthly dashboard for Brussels and Wallonia.
- Network tariffs and capacity tariff 2026: VREG (Flanders), Brugel (Brussels), ORES (Wallonia). Levies: Fluvius and ORES tariff sheets.
- Day-ahead prices: EPEX Spot Belgium via Energy-Charts (Fraunhofer ISE), 15-minute resolution.